3. Sequence Diagram
A sequence diagram shows the interaction between several communication partners. Each communication partner is represented by a rectangle (header) with a line (lifeline), which can be dashed and represents the lifetime of the communication partner.
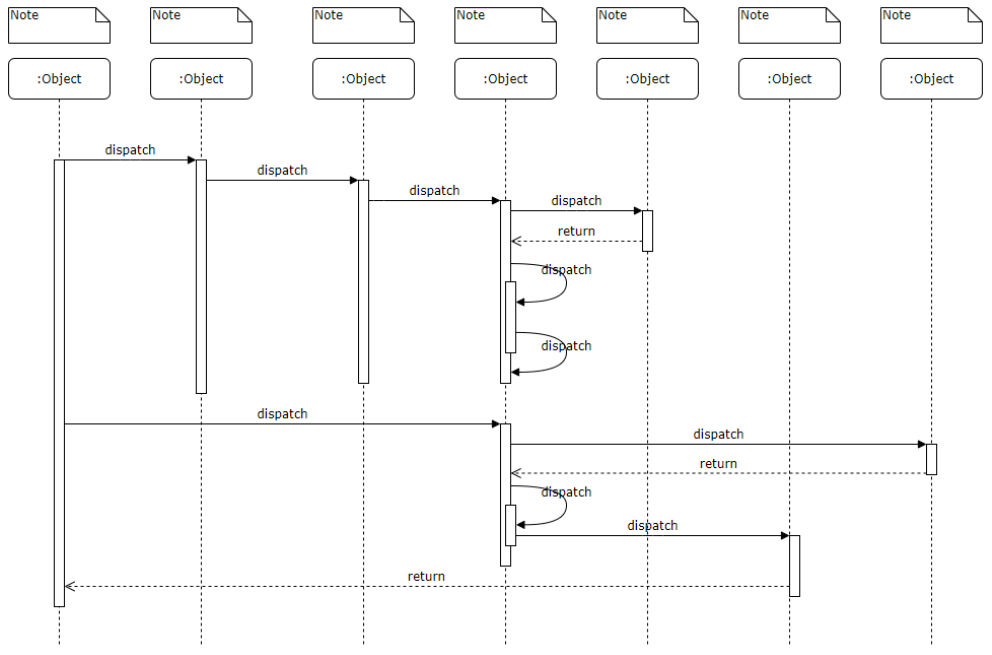
The interaction between communication partners can be done by a synchronous or an asynchronous message. In the synchronous message, the sender waits until the receiver has completed the requested processing. The receiver sends a response message to the sender, which implicitly communicates the end of the requested processing and may also contain response data.
In the asynchronous message, the sender does not wait for the receiver to complete the processing, but continues its own processing in parallel.
Synchronous messages are indicated by an arrow with a filled arrow spit, and asynchronous messages are indicated by an arrow with an open arrow spit. The reply of a synchronous message is a dashed arrow. The amount of time it takes for a communication partner to perform the requested processing can be modeled by a bar on the dashed line.
Hint
Sequence diagrams can be created online: https://sequencediagram.org/